

People Analytics – Less for More

Driving efficiency with People Analytics
One of the key performance indicators (KPI) for SaaS (Software as a Service) based companies is revenue/profit per employee (RPE or PPE). McKinsey[1] team brought out the need to measure profit per employee as one of the ley metrics for software companies in 2007. Unlike ROC, return on capital, measured for manufacturing and other conventional companies, new-age digital companies need better measurement yardsticks. PPE is one such metric. PPE is a measure of Return on Talent. It’s also an indicator of frugality while upholding a high-performing culture. The assumption is smarter your people are, the faster your company’s growth is!
Today, top-notch tech companies like Google and Microsoft can achieve much more in sales /revenues with fewer employees. Facebook and Apple generate a whopping $4 million Revenue per Employee (RPE). WhatsApp story is phenomenal in this regard. When Facebook acquired the company for an astonishing $19 billion, it had 35 engineers and reached more than 450 million users. Its revenue per employee is one of the highest, $7.27M!
Among the Indian companies, Infosys leads the bandwagon with an RPE (Revenue per employee) of $54,000. TCS and Wipro follow suit with $49,000 and $48,000, respectively, as per the industry reports published in 2021. Do note that revenue, not profit, is measured here. While revenue could be staggeringly higher in value, the real acid test and the measure has to be profit per employee. PPE considers the cost of doing the business and the actual value employees bring to the organization.
[1] “Mobilizing Minds: Creating Wealth from Talent in the 21st-Century Organization,” a book by McKinsey partners Lowell Bryan and Claudia Joyce.
Who is responsible for improving PPE in an organization?
RPE/PPE is published as an essential metric in the annual reports of companies today. But, the question is, who among the below three holds the primary responsibility of tracking or monitoring this metric?
- CHRO, who has the mandate of hiring and retaining talented team members who can deliver phenomenal results?
- Business unit leaders, who drive revenue and cost leading to profitability through the team?
- CEO, since PPE is an industry benchmark to measure the efficiency of the systems in place?
A safe answer would be each of them must be aware and accountable to improve this measure, and hence this is a collective responsibility of HR, the business unit heads and the CEO.
Measuring PPE: Where to start?
- A good starting point will be to measure the department/business unit-wise PPE to create an internal benchmarking system. Consider the total revenue and profit by the department divided number of full-time employees.
- Place the departments/business units in the quadrant below in the form of a bubble chart representing the size/contribution of the division.
- Once placed in each quadrant, identify the best and worst practices among the business units and share the lessons learnt. You will be astonished by the results of this exercise, especially when we map the cost structures across departments and business units.
- Next, check the profit/revenue per employee of the market leaders in similar or different industries and develop a conceptual map on where your organization is placed in the quadrant.
- Analyze the possible reasons why different organizations are placed where they are: is it their pricing, selection of product portfolio, innovative business models or purely a set of talented teams or a combination of these or more?
- Create a set of action plans to move your team to the next best quadrant. These actions would range from identifying employees whose lifetime value is lower than others and upskilling them to innovating business models, pricing corrections, etc.
- Monitor the progress quarterly, bi-annually and annually to move forward.
PPE Quadrant
The quadrant can come in handy when we place the departments/business units/organizations based on the context. Make sure to pick comparable teams instead of too many diverse groups for this exercise. Another control factor is the no of years in the business, ensuring parity while comparing. However, considering the phenomenal growth of young startups today, breaking the one billion revenue less than three years, such controls may lead to playing safe. Refer to the success stories of Cred, Phonepe, Byju’s etc.
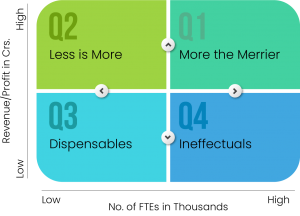
Legend:
FTE = Full time employees L = Low H = High
Q1: More the Merrier: High in headcount and high in revenue/profit: Performance-driven team; quality and quantity go hand in hand. More, the merrier.
Q3: Dispensables: Low in headcount and low in revenue/profit: Ordinary performance, everyone here plays safe, no risks takers, and hence dispensable.
Q4: Ineffectuals: High in headcount and low in revenue/ profit, or a team of vagabonds who needs immediate pruning, skilling, firing or realignment.
Q2: Less is More: Low in Headcount, high in revenue, representing a Golden team. Less is more, and everyone is a 10x contributor, a dream team where the money ball is.
Placing the teams in the quadrant helps diagnose the current people practices, cost structures and related bottlenecks.
Check out a short video here. Do write to us to know more about data-driven initiatives to drive results.